Learning objectives
Distinguish MR molecular design from proof of TADF; diagnose the meaning of SRCT and vibronic linewidth; preserve PL/EL and nm/eV spectral conventions; interpret state-resolved versus effective RISC; and assess EQE, efficiency roll-off and operational stability using explicit device conditions.
Abstract
Multiple-resonance thermally activated delayed fluorescence (MR-TADF) combines an electronic-structure design motif with a potential triplet-to-singlet recovery pathway, but narrowband emission does not by itself establish TADF. This guide distinguishes site-selective B/N resonance from measured transition-density character, relates geometric relaxation and mode-specific vibronic coupling to photoluminescence (PL) and electroluminescence (EL) bandwidths, and separates microscopic ISC/RISC steps from effective rates obtained by kinetic fitting. The evidence is organized across molecule, doped film and complete OLED. Historical case studies cover the 2016 MR demonstration, the 2019 ν-DABNA emitter/device comparison, the theoretical T₁→T₂→S₁ mechanism for DABNA-1, and a 2025 regioisomer study whose publisher abstract and graphical abstract disagree about maximum EQE. Device efficiency, hyperfluorescence architectures and chemical degradation are considered without equating performance metrics across different conditions. This is a literature-based scientific teaching guide, not a report of new experiments.
1. MR-TADF in the OLED landscape
Conventional twisted donor–acceptor TADF often lowers exchange splitting through spatial redistribution of the excitation, but strongly charge-transfer-like singlets may exhibit environmental sensitivity and broader emission. In representative B/N MR frameworks, electron-rich and electron-poor positions produce alternating electronic contributions within a conjugated core. Combined with appropriate rigidity and excited-state relaxation, this design can support strong fluorescence with comparatively narrow spectra [1][4][9]. These benefits are conditional, not defining properties of every MR scaffold.
MR describes a design/electronic-structure motif; TADF additionally requires evidence for thermally accessible triplet-to-singlet conversion. A narrowband MR dye may also function merely as the terminal fluorophore in a sensitized device. Delayed photons can arise from RISC, triplet–triplet annihilation (TTA), trap-assisted processes or other channels. “MR emitter”, “MR-TADF emitter” and “MR terminal emitter in hyperfluorescence” should not be used interchangeably [4][7].
2. Resonance-controlled excited states and the limitations of orbital cartoons
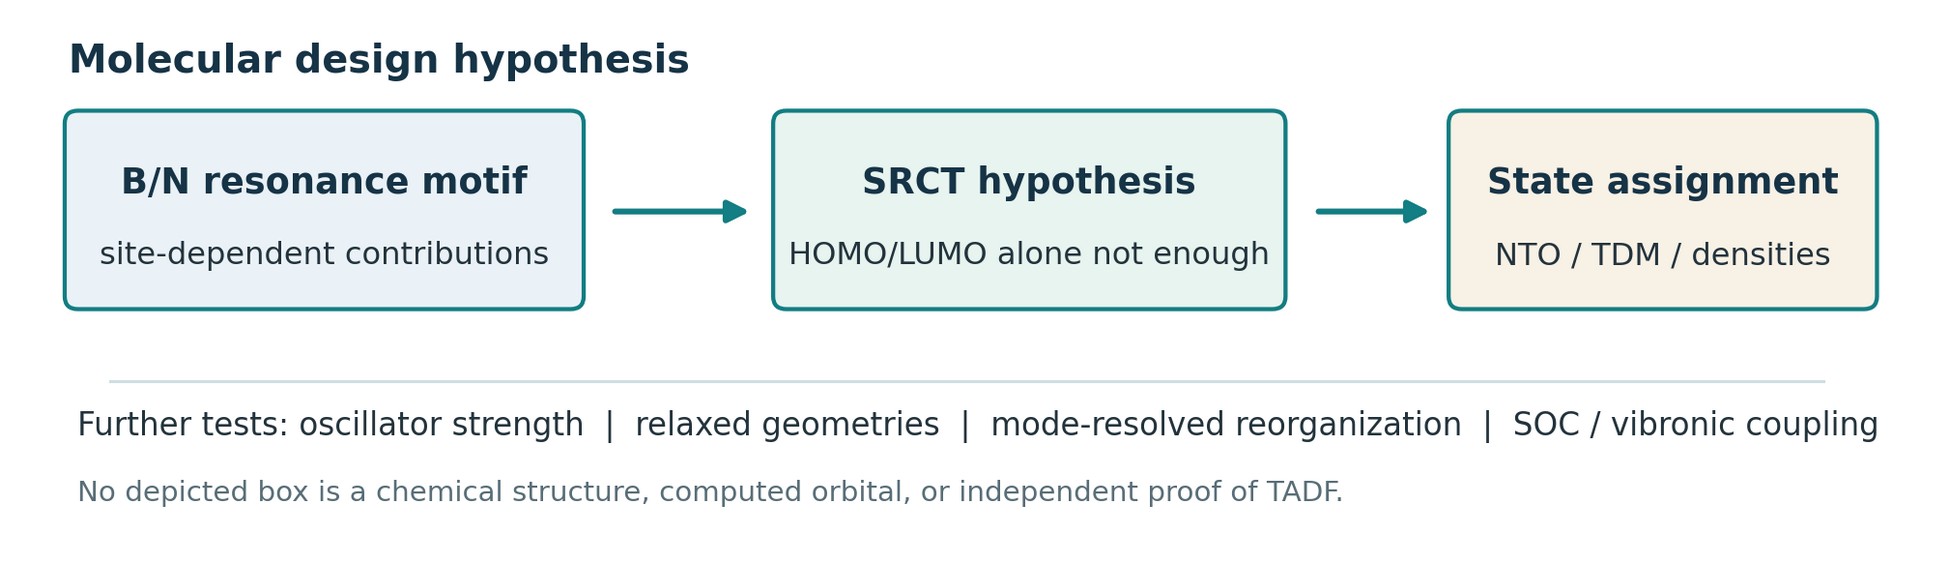
A staggered HOMO/LUMO picture is useful for illustrating site-selective resonance, but neither frontier-orbital overlap nor a single excitation sketch uniquely describes the emitting state. Natural transition orbitals (NTOs), transition-density matrices (TDMs), attachment/detachment densities and appropriately correlated excited-state calculations better characterize electron–hole redistribution. The phrase short-range charge transfer (SRCT) should be justified for a named state, geometry and method, and not inferred from the presence of boron and nitrogen alone [3][4].
For molecular interpretation, compare the S₀ and S₁ relaxed geometries, mode-resolved displacements and Huang–Rhys factors, transition oscillator strength, relevant singlet/triplet characters, and spin–orbit/vibronic couplings. The vertical S₁–T₁ splitting at a chosen geometry, an adiabatic relaxed gap, a film spectral-onset estimate and an Arrhenius slope extracted from delayed emission are not automatically the same physical quantity. Mixing them in cross-material fits creates avoidable model bias [3][4].
3. Narrowband emission: mode-resolved vibronic structure and spectral domain
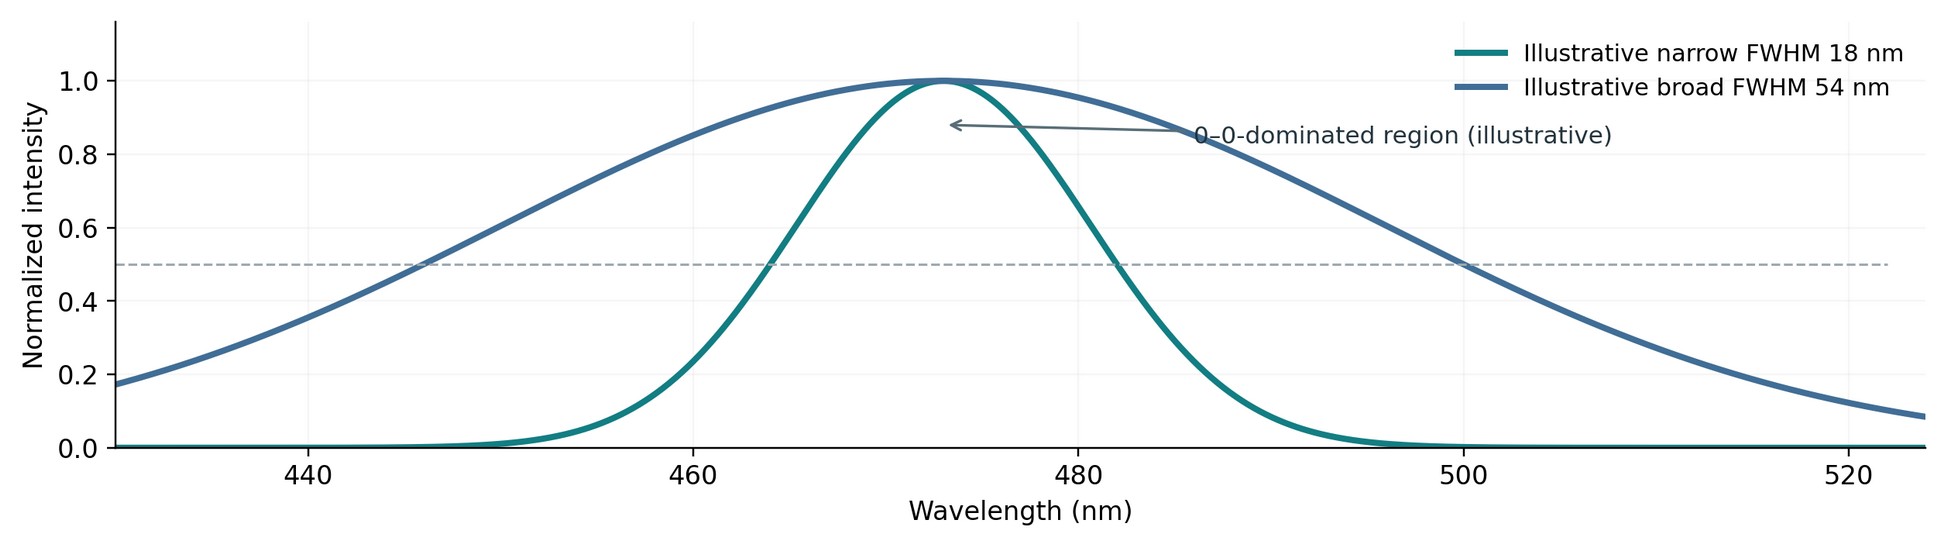
When the emitting S₁ and ground S₀ equilibrium geometries are sufficiently similar, the 0–0 contribution can be prominent and some vibrational sidebands can be weaker. Rigidity can limit selected low-frequency distortions; nevertheless, specific high-frequency modes may retain substantial vibronic coupling. A strong 0–0 feature therefore does not imply uniformly small Huang–Rhys factors for every normal mode, and an MR designation never determines a universal FWHM [2][3][4][9].
Measured bandwidth also depends on matrix polarity and disorder, conformer distributions, concentration, aggregate/excimer states, temperature, and optical cavity effects. Compare solution PL, doped-film PL and electrically driven EL separately. A narrow PL band is useful evidence, not a substitute for the complete device EL spectrum [2][4].
3.1 Wavelength-domain versus energy-domain FWHM
For a sufficiently narrow and approximately symmetric band centered at λ₀, local linearization yields ΔE_FWHM ≈ (hc/λ₀²)Δλ_FWHM, with hc ≈ 1240 eV·nm. This is an approximation to a local width change, not an exact conversion of a full recorded spectrum. The spectral density must transform with its Jacobian: if Iλ is per unit wavelength, then IE(E) = Iλ(λ) |dλ/dE| = Iλ(λ)λ²/(hc). Consequently the peak and FWHM may shift after a correct density transformation. Wavelength-domain FWHM and energy-domain FWHM require a stated convention.
| Quantity | Required context | Invalid shortcut |
|---|---|---|
| PL FWHM | Solution / doped / neat film; loading; temperature | Assume equivalent to driven-device EL |
| EL FWHM | Complete stack; luminance/current; viewing direction | Assume purely molecular linewidth |
| Peak wavelength / CIE | PL or EL; full spectrum and color coordinates | Infer color purity from peak alone |
| Energy-domain FWHM | Density transformation and linewidth method | Convert only the two numerical endpoints without definition |
4. Reverse intersystem crossing: state-resolved microscopic routes
RISC depends on energy separations, state character, spin–orbit matrix elements, vibronic coupling, nuclear motion and temperature. A small ΔE_ST is helpful in many cases but is neither a measured RISC rate nor proof of a specific path. Higher triplet states can participate when the relevant couplings and thermal access are favorable [3][4].
Shizu and Kaji used EOM-CCSD electronic-state analysis, Fermi’s golden-rule rate estimates and kinetic population modeling for DABNA-1. Their calculations favor thermally activated internal conversion T₁→T₂, followed by the spin-changing T₂→S₁ RISC step and S₁→S₀ fluorescence; their analysis also discusses the reverse S₁→T₂→T₁ ISC formation route. This is a molecule- and model-specific mechanism, not an experimentally universal MR-TADF rule [3].
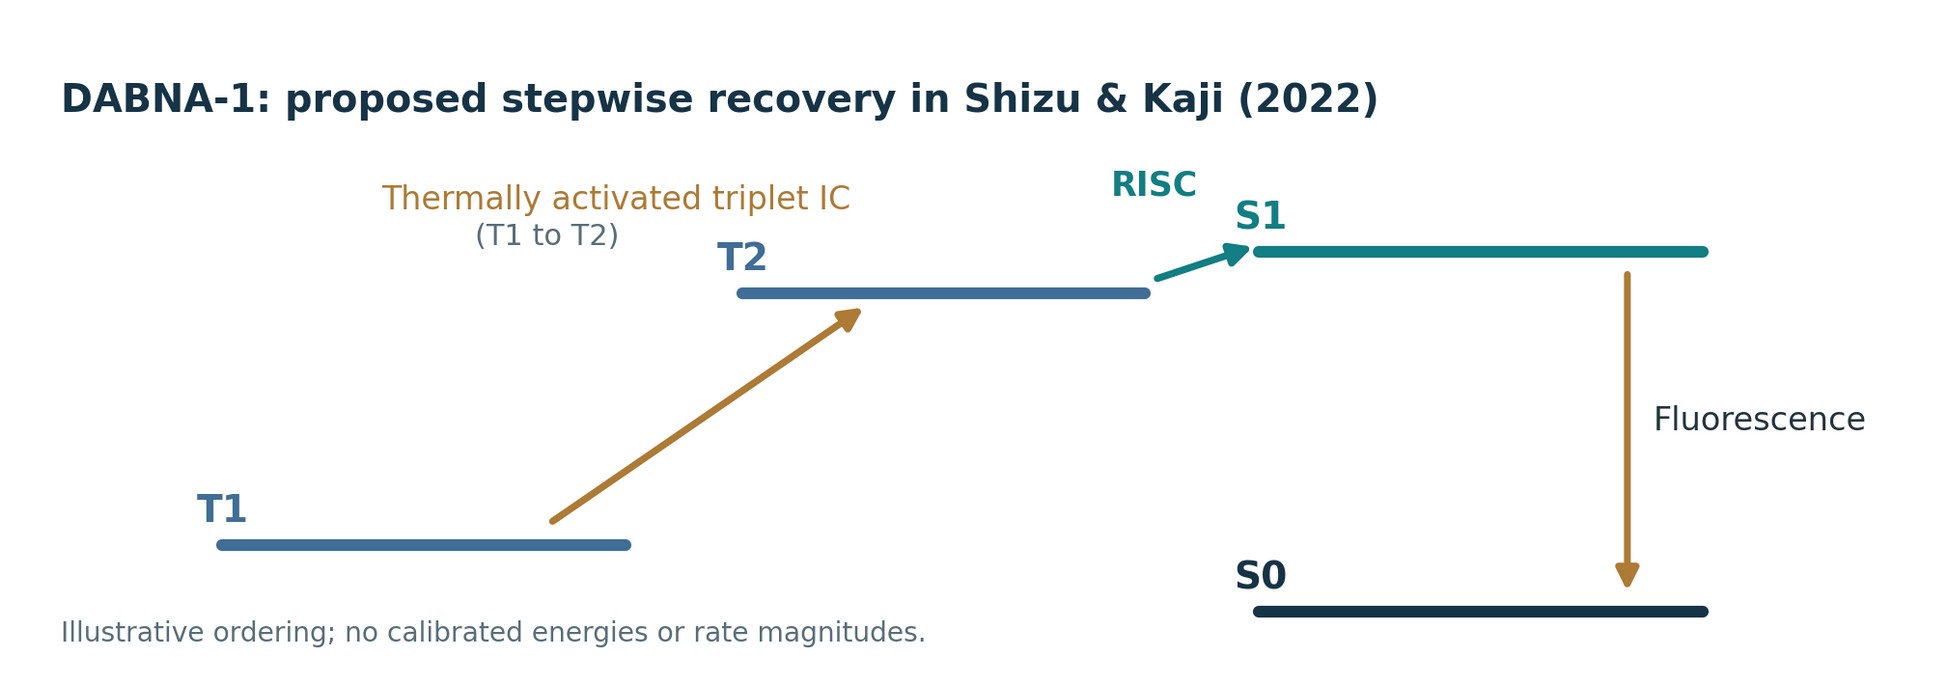
A fit of time-resolved PL to a two-population model may yield a single effective k_RISC even when several triplet states underlie the conversion. Delayed emission lifetime is a coupled kinetic eigenmode and generally τ_delayed ≠ 1/k_RISC. Report microscopic calculated transitions and experimentally inferred effective rates separately, with medium, temperature, fitting equations and uncertainty intervals [3].
5. Competing kinetics, concentration and aggregation
A minimal effective S/T model illustrates the bookkeeping and its limitations. Let S, T and p be emitter-associated singlet, triplet and polaron number densities (cm⁻³); G_S and G_T are generation rates (cm⁻³ s⁻¹). A simple spatially homogeneous model is:
All one-body k values are s⁻¹, while k_TTA and k_TPQ are cm³ s⁻¹. Under the explicitly chosen encounter convention, k_TTA T² is the number of TTA events per unit volume per unit time, each event consumes two triplets, and f_S (between 0 and 1) is the fraction producing one singlet in the specified S pool. f_S is not a delayed-photon yield. The +k_RISC T/−k_RISC T and +k_ISC S/−k_ISC S pairs conserve excitation count between the two selected pools before other processes are included.
This teaching model omits explicit T₂/³LE subpopulations, host excitons, singlet–triplet annihilation, transport, electric-field effects, back transfer, and concentration-dependent rates. Accordingly its k_RISC is an effective transfer parameter, not automatically the elementary T₂→S₁ rate. It must not be fitted uncritically to optical and electrically driven data as though excitation generation and carrier densities were identical.
Concentrated, often relatively planar MR emitters can show aggregation-caused quenching or other intermolecular states. Peripheral shielding, host engineering and regioisomerization offer competing design levers, but may simultaneously change charge trapping, alignment and morphology. Loading-dependent spectra and PLQY, transient responses and charge-selective device controls are needed for causal attribution [4][5][6].
| Molecular lever | Proposed benefit | Required independent check |
|---|---|---|
| B/N topology | Tailored short-range excitation and brightness | NTO/TDM, oscillator strength, PL |
| Rigidity / modes | Reduced geometry relaxation and some sidebands | Mode-specific vibronic analysis |
| Peripheral shielding | Reduced intermolecular contact and ACQ | Concentration series, PLQY, aggregate spectroscopy |
| Regioisomerization | Changes triplet coupling and steric environment | RISC-fit uncertainty, transport/morphology controls |
| Host / confinement | Tune state energies and leakage | Same-emitter host series, triplet back-transfer |
6. Primary literature: preserve numerical measurement boundaries
6.1 Benchmark 2016 and 2019 demonstrations
Hatakeyama et al. reported a B/N MR-associated OLED with electroluminescence at 467 nm, EL FWHM 28 nm, CIE (0.12, 0.13) and an estimated internal quantum efficiency near 100% [1]. The last value is an author-reported device-related IQE inference; it is not measured external EQE.
Kondo et al. reported ν-DABNA with an emitter fluorescence FWHM of 14 nm and a complete-device EL peak at 469 nm with EL FWHM 18 nm. Maximum device EQE was 34.4%, compared with 26.0% at 1000 cd m⁻² [2]. Assign the 14 nm and 18 nm figures to their distinct measurement domains; a change in width does not, by itself, identify its molecular versus optical-stack origin.
6.2 Ming 2025: an unresolved discrepancy on the same publisher page
For a regioisomer-engineered emitter, the Wiley text abstract gives k_RISC = 7.1 × 10⁵ s⁻¹, PLQY = 94%, FWHM = 23 nm, maximum OLED EQE = 32.4% and EQE at 1000 cd m⁻² = 22.2%. It also identifies a distinct example at 20 wt% with EQE_max = 29.4% [5]. In the accessible abstract, the 23 nm linewidth is not unambiguously tied to a particular film or complete-device EL condition; it is therefore kept as “source abstract, domain not independently checked”. The rate is treated as inferred or model-dependent unless its extraction protocol has been audited.
The same Wiley page states an OLED EQE of 32.7% in the graphical abstract, versus 32.4% in the text abstract. These values may represent different sample conditions, a revision artifact or a reporting error. Without reconciliation against the original main figures and supporting tables, this manuscript preserves both numbers as a SOURCE-INTERNAL DISCREPANCY and does not rank the study by a selected maximum [5].
| Study | Spectrum and optical context | Efficiency / kinetic result | Evidence boundary |
|---|---|---|---|
| Hatakeyama 2016 [1] | OLED EL 467 nm, 28 nm FWHM | IQE ~100% (reported estimate) | Publisher abstract; not EQE |
| Kondo 2019 [2] | Emitter PL 14 nm; device EL 469 nm / 18 nm | EQEmax 34.4%; EQE at 1000 cd m⁻² 26.0% | Emitter and OLED domains distinct |
| Ming 2025 [5] | FWHM 23 nm; domain needs main/SI verification | k_RISC 7.1×10⁵ s⁻¹; PLQY 94%; EQE at 1000 cd m⁻² 22.2% | Publisher text abstract, rate model context open |
| Ming 2025 [5] | No additional linewidth assignment | EQEmax 32.4% (text) / 32.7% (graphic) | UNRESOLVED publisher-level mismatch |
7. Translating molecule and film properties into OLED performance
With defined counting boundaries, external quantum efficiency can be represented schematically as EQE = γ × Φ_int,eff × η_out, where γ is useful excitation generation per injected electron–hole pair, Φ_int,eff the conditional eventual internal-photon probability (including ISC/RISC, transfer and competing loss once), and η_out the escaped fraction for a defined detection convention. This is a bookkeeping factorization, not proof that the factors remain independent when a device is modified.
Do not multiply an independent triplet harvesting factor into the expression if RISC utilization is already counted in Φ_int,eff. A sensitized device also requires careful accounting of sensitizer excitation, triplet recovery, energy transfer to the terminal dye and escape of terminal-dye photons. Optical cavity and dipole orientation can change EL spectra and extraction without altering isolated-molecule vibronic coupling.
Charge balance, recombination-zone position, host/guest confinement, exciton and polaron densities, field-dependent transport and quenching can dominate device roll-off or aging. Meaningful comparisons require EQE-versus-luminance and current, J–V–L, operating voltage, angular/color measurements, stack composition and uncertainty. Neither a high PLQY nor a narrow film PL band establishes high-brightness EQE or LT95/LT97 under actual driving stress.
8. Direct MR-TADF versus sensitized MR-terminal fluorescence
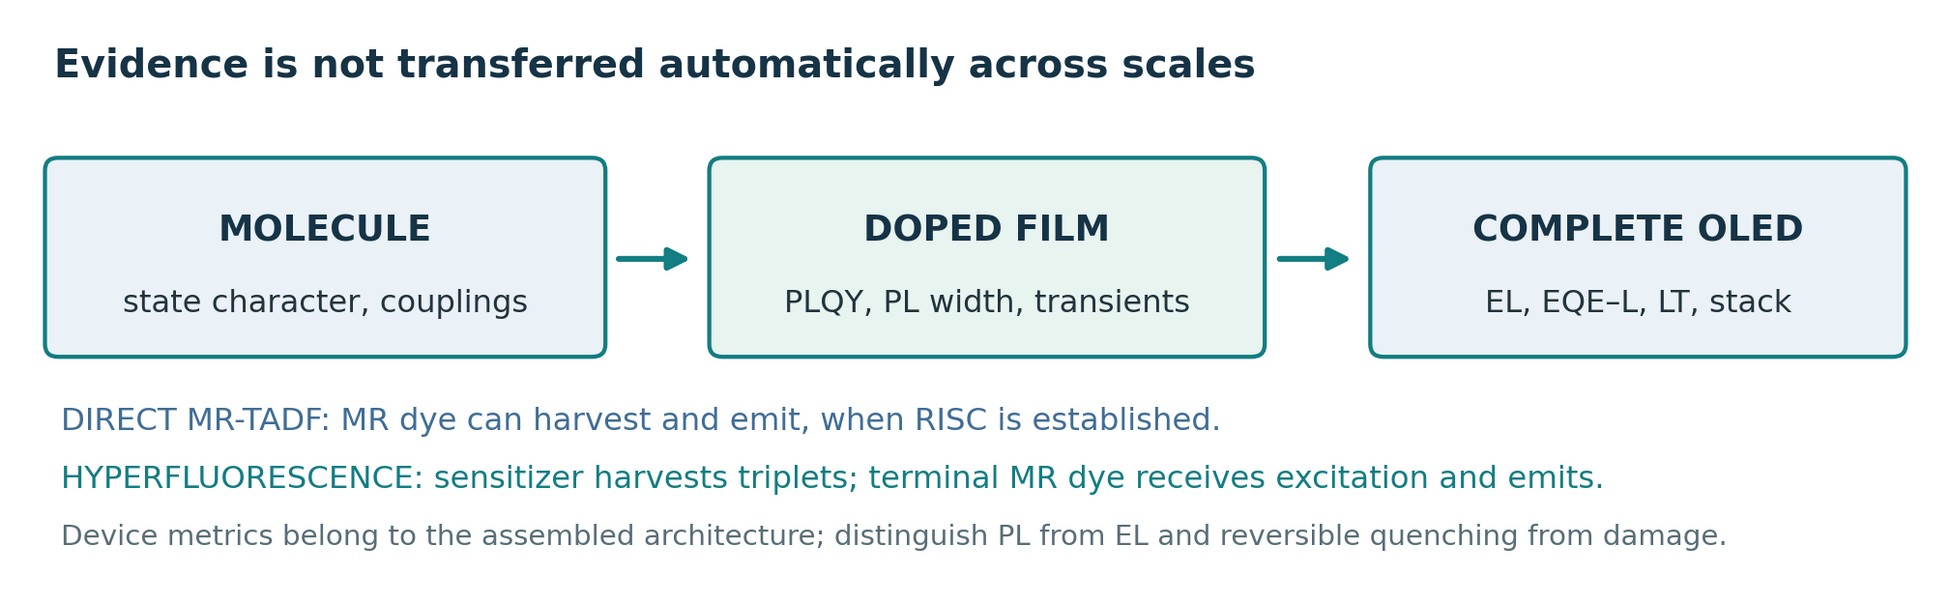
In direct MR-TADF, an MR molecule can both participate in its own triplet-to-singlet recovery and radiate, when such a mechanism is demonstrated. In hyperfluorescence, a separate TADF sensitizer can convert triplet-origin excitation and transfer singlet energy to a narrowband MR terminal fluorophore, commonly through an allowed long-range resonant mechanism. Dexter-type triplet leakage, direct trapping and incomplete sensitizer-to-terminal transfer may counteract the benefit. The terminal dye does not need a large intrinsic k_RISC to be useful in the sensitized architecture [7][8].
Huang et al. reported a deep-blue device containing a TADF sensitizer and a multiple-resonance terminal emitter, with EQE_max = 30.8%, LT95 = 221 h at initial luminance 1000 cd m⁻², and CIE (0.14, 0.17) [8]. These metrics belong to the assembled OLED and the stated operating protocol. They should not be ascribed to the isolated terminal MR emitter or the sensitizer by itself.
9. Stability: distinguish reversible quenching and chemical degradation
Reversible exciton/polaron quenching under operation is not equivalent to chemical destruction. Jhun et al. studied selected 1,4-azaborine MR-TADF materials using oxidative tests, chemical-product analysis, calculations and deuteration comparisons. In the tested series, the authors support radical-cation-related intramolecular cyclization together with hydrogen-atom abstraction-related pathways as relevant to degradation [6]. The mechanism is conditional on molecular chemistry and oxidation context, not a blanket failure mode for all MR cores.
Report lifetime as LT95, LT97 or LT50 with L₀, control mode (constant-current or constant-luminance), driving current density, stack, guest loading, device area, sample count, temperature and error intervals. Two devices at the same starting luminance may operate at different currents and recombination-zone profiles; a lifespan ratio alone cannot isolate the role of RISC. Robust attribution connects stress, products, transport and optical controls.
10. Falsifiable measurements and alternative explanations
| Claim / experiment | What is constrained | What is not proven alone |
|---|---|---|
| Dilute / doped / neat film PL | Host/concentration linewidth, aggregation changes | Microscopic RISC channel |
| Temperature- and fluence-resolved PL | Activated and density-dependent components | Arrhenius slope equals ΔE_ST |
| Triplet-sensitive transient absorption | Population and CT/LE assignment constraints | Unique device-level k_RISC without model |
| Angular and current-dependent EL | Stack optics and driven spectral response | Gas-phase molecular linewidth |
| Chemical aging + OLED lifetime | Irreversible products and stress correlation | Universal degradation mechanism |
A minimally discriminating MR-TADF workflow combines source-locked molecular structure; NTO/TDM and vibronic calculations; calibrated steady-state and time-resolved PL; temperature/fluence/loading series; independent transient triplet evidence; and driven-device EL/EQE/lifetime records under documented stack conditions. Where several kinetic parameter sets fit the same data, report uncertainty and identifiability rather than one deceptively exact rate.
11. Open research questions and evidence-led agenda
Molecule: Can state-specific transition densities, SOC and mode-resolved displacements predict spectra and spin conversion out of family? Film: Under which host and loading ranges does an emitter retain high PLQY, narrow PL and reproducible kinetics? Device: When transport, optical cavity, host transfer and exciton density are controlled, does a demonstrably improved RISC mechanism explain lower roll-off? Chemistry: Which independently identified chemical aging products, redox states and isotope effects explain stability differences in related series?
A reusable benchmark requires canonical molecular identity, host and loading, PL/EL spectral domains, temperature and excitation conditions, model derivation and uncertainty of k_RISC, full OLED stacks and reproducible lifetime stress protocols. Because material classes and device architectures differ, out-of-family prediction is a better test than ranking by a maximum EQE or a minimum FWHM alone.
12. Conclusions and publication decision boundary
Multiple-resonance design can create narrowband, bright emission, but controlled linewidth, triplet recovery, resistance to aggregation and chemical stability are separate objectives. The 2016 and 2019 demonstrations establish important optical and device feasibility; the DABNA-1 higher-triplet sequence is a particular calculated model; and the 2025 regioisomer study illustrates the value of independent source and sample attribution even for headline device numbers. Evidence must always carry its measurement or theoretical domain.
| Review item | v3 resolution or remaining gate |
|---|---|
| Scientific classification | MR electronic motif / RISC evidence / sensitized architecture separated |
| Spectral conversion | Jacobian of spectral density and domain-labeled FWHM added |
| DABNA-1 interpretation | Microscopic T₁→T₂→S₁ versus effective fitted k_RISC separated |
| Kinetic equation | Explicit TTA encounter convention and S/T population balance |
| Ming 2025 | Abstract/graphic EQE discrepancy and 23 nm domain remain OPEN |
| Owner / website decision | Scientific owner signoff pending; no publication or deployment authorized |
References
- [1] Hatakeyama, T. et al. Ultrapure blue thermally activated delayed fluorescence molecules: Efficient HOMO–LUMO separation by the multiple resonance effect. Advanced Materials 28, 2777–2781 (2016). DOI: 10.1002/adma.201505491
- [2] Kondo, Y. et al. Narrowband deep-blue organic light-emitting diode featuring an organoboron-based emitter. Nature Photonics 13, 678–682 (2019). DOI: 10.1038/s41566-019-0476-5
- [3] Shizu, K. & Kaji, H. Comprehensive understanding of multiple resonance thermally activated delayed fluorescence through quantum chemistry calculations. Communications Chemistry 5, 53 (2022). DOI: 10.1038/s42004-022-00668-6
- [4] Wu, X., Ni, S., Wang, C.-H., Zhu, W. & Chou, P.-T. Comprehensive review on the structural diversity and versatility of multi-resonance fluorescence emitters. Chemical Reviews 125, 6685–6752 (2025). DOI: 10.1021/acs.chemrev.5c00021
- [5] Ming, R. et al. Regioisomerization-directed MR-TADF emitters: Enhanced RISC and suppressed aggregation toward high-performance narrowband blue OLEDs. Angewandte Chemie International Edition 64, e202516696 (2025). DOI: 10.1002/anie.202516696
- [6] Jhun, B. H. et al. The degradation mechanism of multi-resonance thermally activated delayed fluorescence materials. Nature Communications 16, 392 (2025). DOI: 10.1038/s41467-024-55620-0
- [7] Deori, U., Nanda, G. P., Murawski, C. & Rajamalli, P. A perspective on next-generation hyperfluorescent organic light-emitting diodes. Chemical Science 15, 17739–17759 (2024). DOI: 10.1039/D4SC05489J
- [8] Huang, T. et al. Delocalizing electron distribution in thermally activated delayed fluorophors for high-efficiency and long-lifetime blue electroluminescence. Nature Materials 23, 1523–1530 (2024). DOI: 10.1038/s41563-024-02004-w
- [9] Keerthika, P., Nutalapati, V. & Konidena, R. K. A guide to mastering multi-resonance thermally activated delayed fluorescence. Journal of Materials Chemistry C 13, 17416–17457 (2025). DOI: 10.1039/D5TC01861G
Source access and editorial scope
This v3 was revised directly from the owner-supplied seven-page Revised v2 PDF (27 October 2026). Numerical claims from [1], [2], [5], and [8] were cross-checked against publisher abstracts; the DABNA-1 mechanism [3] was checked against accessible original full text; [6] was checked against open primary-study reporting at the level recorded in the companion audit. The remaining review sources inform context, but this pass does not assert that every full text or Supporting Information file has been exhaustively re-audited. All four educational figures have been retained from the owner-supplied v2, rather than copied from publisher figures.