Primary study: Huang et al., Nature Photonics 18, 516–523 (2024), DOI: https://doi.org/10.1038/s41566-024-01379-1.
The question behind the efficiency and lifetime numbers
What does replacing hydrogen with deuterium actually achieve in blue thermally activated delayed fluorescence (TADF) OLEDs? Huang and colleagues offer an unusually useful experiment: rather than introducing an entirely new emitter scaffold, they compare hydrogenated and highly deuterated versions of two established TADF families, 5CzBN and 5tCzBN. They then use these compounds as sensitizers for the narrowband terminal emitter ν-DABNA in TADF-sensitized fluorescent (TSF) OLEDs. The published work combines molecular spectroscopy, model-derived excited-state rates, solid-state photophysics, electroluminescence and operational lifetime [1–3].
The headline TSF-B result—EQEmax 33.1% and LT80 1,365 h at initial luminance 1,000 cd m⁻²—is striking. It is also crucial to keep the metrics separate: 33.1% is a peak external quantum efficiency, not the measured EQE at 1,000 cd m⁻² (29.0%); LT80 is the elapsed time to 80% of initial luminance, not a chemical half-life; and CIE y = 0.20 describes a blue color point, not the same optical output as the deeper-blue TSF-A (CIE y = 0.14) [1, pp. 516, 521–522; 2, Table S4].
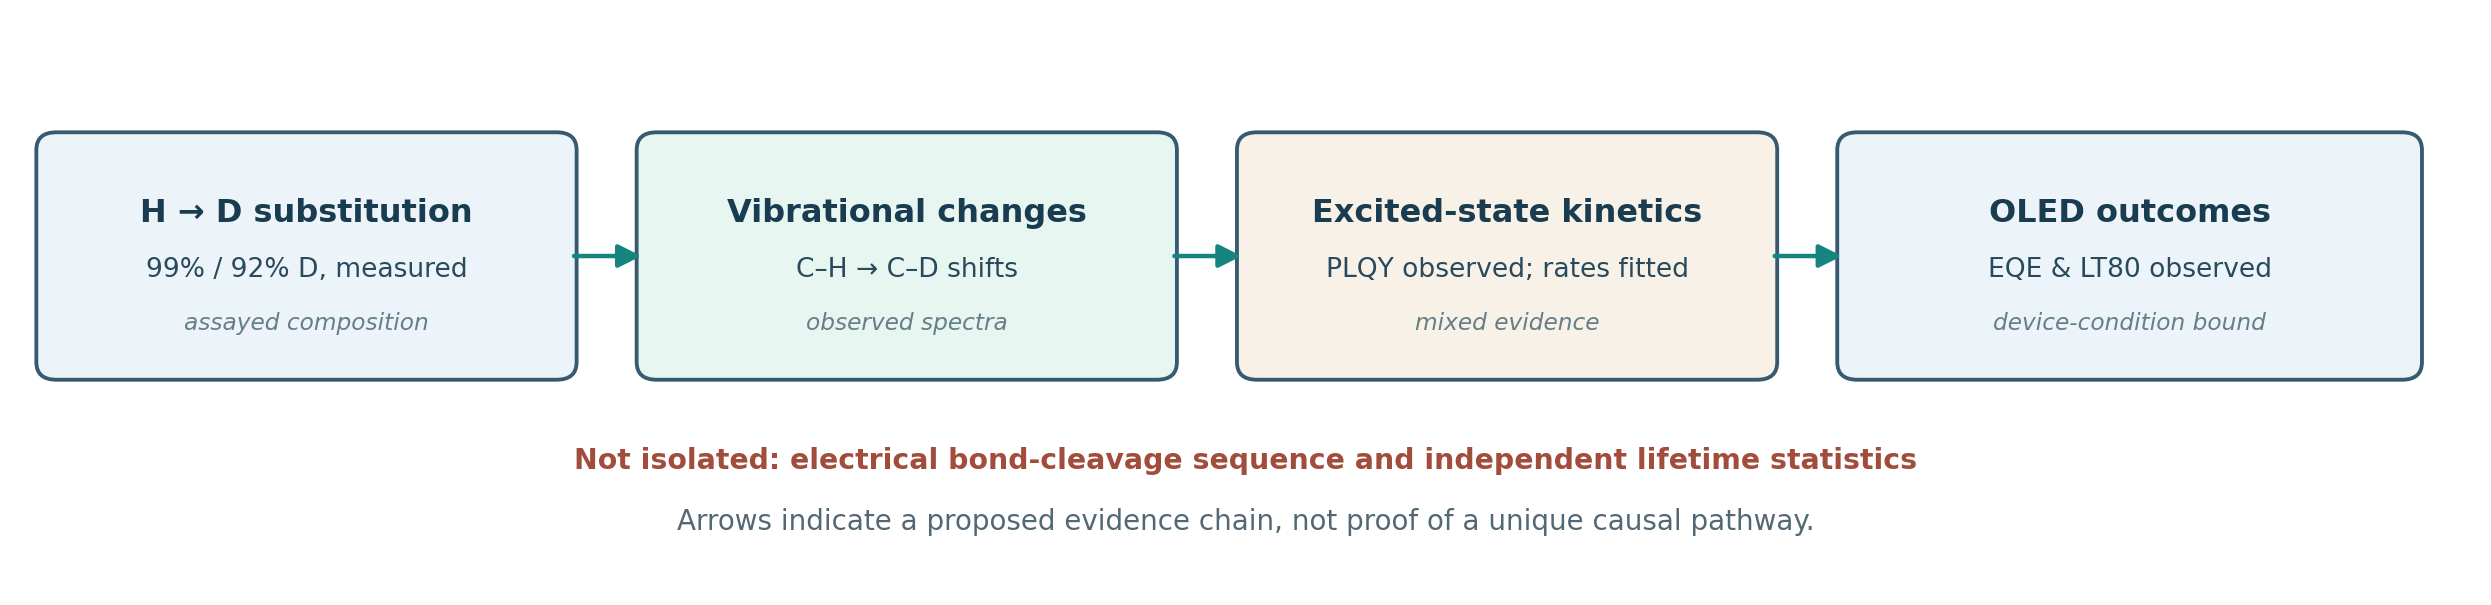
The strongest support for an isotope effect is now visible in four explicitly paired TSF devices, alongside two matched TADF emitter families. The evidence supports meaningful improvements under the study's device conditions. It does not alone identify the chemical bond-breaking pathway responsible for lifetime changes, nor establish a universal benefit for every blue OLED architecture.
1. What was substituted, and how completely?
The parent structures are 5CzBN, a pentacarbazole-substituted benzonitrile, and the corresponding tert-butylcarbazole derivative 5tCzBN. Published SI describes PtO₂-catalyzed hydrothermal hydrogen–deuterium exchange in D₂O, followed by coupling to the benzonitrile core. Deuterium incorporation was assessed by proton NMR with an internal standard [1, Fig. 1a and p. 517; 2, Supplementary Notes 1–2, printed pp. 3–5].
The term perdeuterated must not be read as 100% isotope incorporation. Published SI reports 99% D for D-5CzBN and 92% D for D-5tCzBN, with the tert-butyl hydrogens relatively difficult to exchange. An intermediate 70%D-5tCzBN sample was produced, and repeated reactions increased incorporation toward 92% [2, Note 1]. The earlier 2023 Research Square preprint reports 99.9% for D-5CzBN; this is a preprint-versus-published-SI reporting difference, not grounds for silently selecting the extra decimal place [2,3].
Overall D% is an ensemble-average measurement. It does not specify the substitution pattern of every molecule, and is not itself a position-resolved measure of protection at a particular labile bond. The 0%, 70%, 92% progression for the 5tCzBN family offers a partial dose-response experiment, though compositional averages alone do not isolate the influence of specific sites.
2. Vibrational evidence supports an isotope effect, not a complete degradation mechanism
The published Fig. 1 shows an experimentally observed displacement of high-frequency C–H stretching features toward the lower-frequency C–D region, around 3,050 to 2,280 cm⁻¹ in the authors’ broad description. Increased nuclear mass changes normal-mode frequencies and zero-point motion without, to first order, substantially changing the electronic potential-energy surface within the Born–Oppenheimer approximation [1, pp. 517–518, Fig. 1]. The simple harmonic-oscillator inverse-square-root mass relationship is useful for an isolated local mode, but is not a universal multiplier for all coupled vibrations in these large molecules.
Published Figure1 source data report calculated total zero-point energies decreasing from approximately 2,269.4 to 1,931.0 kJ mol⁻¹ for the 5CzBN isotopologues, and 5,177.237 to 4,162.507 kJ mol⁻¹ for the 5tCzBN pair [3, Figure1.xlsx, Fig. 1d–e]. These are computed thermochemical quantities—not observed activation energies for degradation or a direct measure of chemical-bond dissociation rates. Their magnitude also reflects the number of vibrational degrees of freedom; the totals should not be compared across different-sized molecules as an intrinsic stability ranking.
The authors report slower photo-aging in pristine 100 nm films under 360 nm irradiation at about 1 mW cm⁻² [1, p. 517; 2, Figs. S2–S3]. That establishes a difference in photostability under the specified optical stress, not an electrically resolved chemical decomposition pathway. The proposed chain from isotope-sensitive vibration to fewer nonradiative losses and lower vulnerability to degradation is physically plausible, but there are multiple alternative pathways through excited-state populations, polaron chemistry, charge balance and morphology. Identifying bond cleavage in an electrically aged multilayer device requires chemical product analysis and suitable isotope-matched controls.
The published Fig. 2 additionally documents slightly bluer, narrower film PL after deuteration: the 5CzBN pair changes from 479 nm/67 nm FWHM to 476 nm/65 nm; the 5tCzBN pair from 481 nm/70 nm to 479 nm/66 nm, in 15 wt% doped films [1, p. 519, Fig. 2c–d]. These are PL measurements; they must not be treated as OLED EL linewidths.
3. Excited-state rates: a favorable balance, not a universal increase in k_r
Published Table 1 reports solution photoluminescence quantum yields of 0.75 → 0.88 for 5CzBN → D-5CzBN and 0.87 → 0.96 for 5tCzBN → D-5tCzBN. The corresponding doped-film PLQYs increase 0.82 → 0.87 and 0.85 → 0.95, respectively [1, p. 519, Table 1]. The published Table 1 also changes several prompt/delayed solution lifetime values relative to the 2023 preprint; this draft uses the 2024 published entries rather than the earlier values.
The estimated rate constants have a stricter evidence boundary. SI's Method A assumes singlet nonradiative decay can be neglected compared with competing pathways; Method B relaxes that assumption using additional approximations involving triplet decay [2, Note 3, printed pp. 6–7]. These outputs are model-inferred effective rates, not separately measured elementary state-to-state events.
| Isotopologue pair | Solution PLQY, H → D | Film PLQY, H → D | Estimated k_nr,S in solution, H → D (×10⁶ s⁻¹) | Estimated k_nr,S in film, H → D (×10⁶ s⁻¹) |
|---|---|---|---|---|
| 5CzBN / D-5CzBN | 0.75 → 0.88 | 0.82 → 0.87 | 4.65 → 1.83 | 1.88 → 0.77 |
| 5tCzBN / D-5tCzBN | 0.87 → 0.96 | 0.85 → 0.95 | 2.38 → 0.60 | 1.35 → 0.30 |
A crucial qualification is that SI Table S2 estimates effective film k_r to decrease, not increase, upon deuteration: 8.62 → 5.21 ×10⁶ s⁻¹ for 5CzBN and 7.69 → 5.70 ×10⁶ s⁻¹ for 5tCzBN. The same Method A table estimates film k_RISC of 3.95 → 3.89 ×10⁵ s⁻¹ and 4.42 → 4.62 ×10⁵ s⁻¹, respectively [2, Table S2]. Thus neither k_r nor k_RISC universally accelerates in these two films. These model-dependent quantities are not intrinsically inconsistent with higher PLQY: the competing loss channels and time-integrated yields jointly determine the observed light output. Method B produces slightly different numerical rates, reinforcing the need to report the fit method rather than treat any one rate as directly observed.
The 70%D-5tCzBN intermediate adds a useful point: SI Table S1 reports solution PLQY 0.92 and model-estimated k_nr,S 1.33 ×10⁶ s⁻¹; film PLQY is 0.88 in SI Table S2 [2]. These occupy intermediate positions within this limited sample family, while not excluding site distribution or morphological differences.
4. Matched TADF OLEDs provide the clearest lifetime evidence
The published main article now supplies complete device Table 2 and Fig. 3, removing a major v0.1 source-access qualification. The TADF-only devices share the described layer arrangement, including a 24 nm SiCzCz:SiTrzCz2:emitter emitting layer in a 55:30:15 wt% formulation, plus the stated transport and injection layers [1, p. 520]. Operational lifetimes are reported at initial luminance 1,000 cd m⁻² [1, p. 520, Fig. 3f; p. 521, Table 2].
| Published 2024 device | EQEmax (%) | EQE at 1,000 cd m⁻² (%) | EL FWHM (nm) | CIE y | LT80 (h) |
|---|---|---|---|---|---|
| 5CzBN | 25.8 | 22.4 | 69 | 0.26 | 74 |
| D-5CzBN | 29.0 | 25.2 | 67 | 0.24 | 210 |
| 5tCzBN | 26.0 | 22.7 | 65 | 0.30 | 392 |
| D-5tCzBN | 29.2 | 25.7 | 63 | 0.28 | 949 |
| 70%D-5tCzBN (SI) | 26.8 | 25.0 | 64 | 0.29 | 772 |
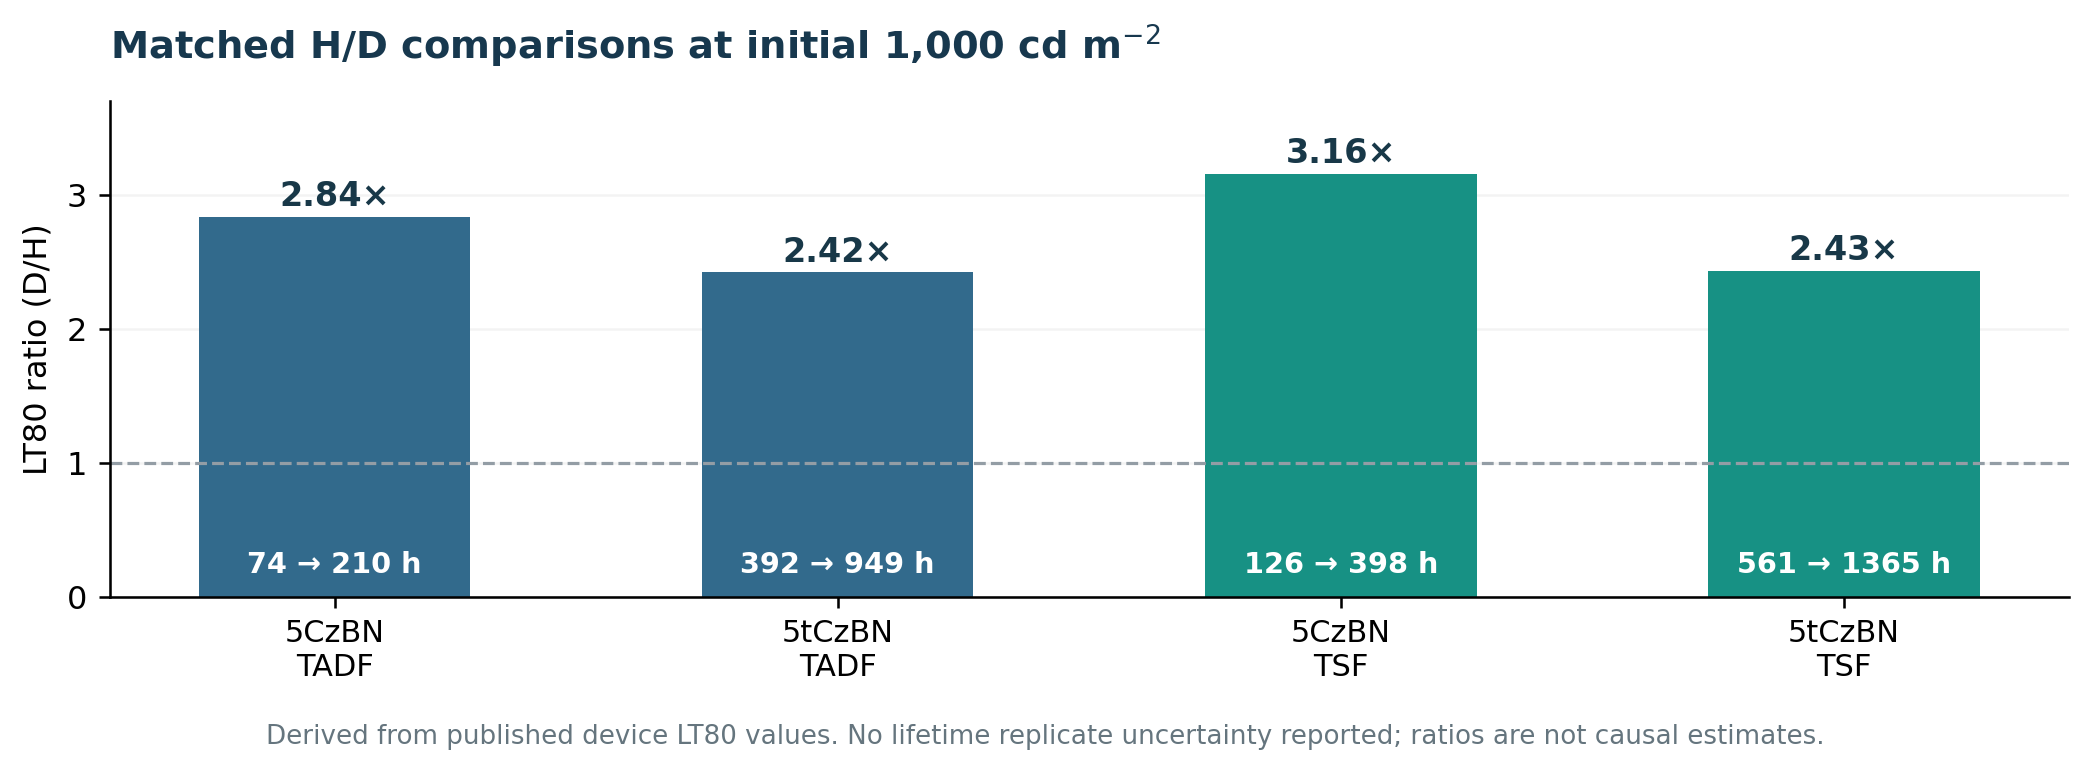
Relative to the paired protonated emitters, reported LT80 increases approximately 2.84-fold (210/74) and 2.42-fold (949/392). These data are strong within-family device associations, reinforced by a graded 70%-D intermediate, but not estimates of intrinsic molecular lifetimes or a deuteration-specific bond-scission rate. All LT80 values share an initial luminance of 1,000 cd m⁻²; because device efficiency and emission spectra change, this does not fix current density, excitation density or internal electrical stress. Neither confidence intervals for independently fabricated lifetime pixels nor a fully reproducible threshold-extraction protocol are available in the reviewed source set.
SI Fig. S10 and official Figure3 lifetime source data support the 5tCzBN trend. Small deviations between individual raw data crossings and the authors' reported threshold can reflect point noise, data smoothing or an unspecified fit. We retain 949 h as the published value, rather than replacing it with an arbitrarily chosen first crossing.
5. The critical new control: four TSF devices, not just two
The 2024 version of record directly identifies the paired sensitizers: TSF-A = D-5CzBN; TSF-C = 5CzBN; TSF-B = D-5tCzBN; TSF-D = 5tCzBN, each paired with the narrowband terminal emitter ν-DABNA [1, p. 521, Fig. 4]. This is a major advance over v0.1, which could only assign TSF-A/B from the preprint. It also allows matched H/D comparisons within the TSF architecture, instead of wrongly treating TSF-A versus TSF-B as the primary isotope control.
| Published TSF device (sensitizer) | EQEmax (%) | EQE at 1,000 cd m⁻² (%) | EL FWHM (nm) | CIE y | LT80 (h) |
|---|---|---|---|---|---|
| TSF-C (5CzBN, H) | 28.2 | 21.3 | 19 | 0.15 | 126 |
| TSF-A (D-5CzBN) | 29.2 | 24.1 | 19 | 0.14 | 398 |
| TSF-D (5tCzBN, H) | 30.4 | 27.2 | 22 | 0.22 | 561 |
| TSF-B (D-5tCzBN) | 33.1 | 29.0 | 20 | 0.20 | 1,365 |
With ν-DABNA as the common terminal emitter, H/D substitutions increase the reported TSF LT80 by 398/126 ≈ 3.16 for the 5CzBN family and 1,365/561 ≈ 2.43 for the 5tCzBN family [1, Table 2]. EQEmax increases 28.2% → 29.2% (+1.0 percentage point) and 30.4% → 33.1% (+2.7 percentage points), respectively; EQE at 1,000 cd m⁻² must remain separately identified. The CIE y shifts (0.15 → 0.14 and 0.22 → 0.20) show that paired spectra are not exactly identical. These ratios summarize device outcomes under the reported protocol without isolating a chemical lifetime mechanism.
The authors propose an additional isotope-related sensitization route: deuteration slightly blue-shifts and narrows the sensitizer solid-state PL, improving overlap with ν-DABNA absorption and decreasing residual broad sensitizer emission in TSF EL spectra [1, pp. 521–522, Fig. 4b–c]. The spectroscopic observation supports the plausibility of Förster transfer, but overlapping steady-state spectra, narrower device EL and improved EQE do not measure a unique FRET transfer rate or total transfer yield under electrical driving. A quantitative claim would require time-resolved donor/acceptor populations, appropriate quenching and concentration controls, and optical/charge-balance analysis. Increased radiative efficiency, recombination-zone shifts and extraction differences remain viable covariates.
Comparing TSF-A directly with TSF-B yields different sensitizers and noticeably different blue color points; it is unsuitable as a clean isotope-only comparison. The BD-02 reference device (EQEmax 25.2%, LT80 505 h, CIE y 0.20) is useful for same-color benchmarking, but is based on a different phosphorescent emitter and is not an H/D control [1, p. 521, Table 2 and p. 522]. No claim of universal commercial readiness follows from these demonstrations.
6. What the full published source set resolves—and leaves open
With the main article in hand, the key source contradictions and previously uncertain details can be separated rather than combined.
| Finding | Evidence and adjudication | Status |
|---|---|---|
| TSF-A LT80: 398 or 468 h? | Published main Table 2/text = 398 h; published SI Table S4 = 398 h; official Figure4.xlsx, “Figure 4f” summary = 468 h. Figure 4e source trace is near 80% at 398.25 h. | OPEN source-data summary inconsistency; 398 h is clearly the publication's reported number |
| TSF-A EQE at 1,000 cd m⁻²: 24.1 or 24.3%? | Main Table 2 and SI Table S4 = 24.1%; Figure4.xlsx, “Figure 4f” label = 24.3%. | OPEN minor plotting-source discrepancy |
| TSF-B EL FWHM: 20 or 19 nm? | Main Table 2 = 20 nm; SI Table S4 = 19 nm. | OPEN precision/definition discrepancy; not silently harmonized |
| 5tCzBN TADF-only LT80: 390 or 392 h? | 2023 preprint = 390 h; published main Table 2 = 392 h, consistent with SI Fig. S10 labeling. | RESOLVED by final version authority |
| Preprint H/D excited-state lifetimes | Preprint Table 1 and final published main Table 1 differ for multiple prompt/delayed values; use final Table 1 (e.g., D-5tCzBN 5.5 ns / 9.7 µs in solution). | RESOLVED by final version authority |
| What do the H/D TSF controls represent? | Final main text assigns TSF-A/B/C/D explicitly; two paired comparisons are possible. | RESOLVED for emitter identity |
| D-5CzBN isotope incorporation | Published SI = 99% D; preprint = 99.9% D; published main does not give a more precise percentage. | Source-specific reporting, not independently reconciled |
The supplied v0.2 source-reconciliation record reports that publisher Figure4 source data include a Figure 4f summary value of 468 h for TSF-A, whereas the published Table 2 and SI Table S4 report 398 h; a source trace point near 80% around 398.25 h is also reported in that record. This v0.3 revision independently checked the published main article and SI against those tabulated values, but the actual Figure4.xlsx workbook was not contained in the present uploaded ZIP and was not re-fitted in this review. Thus 398 h remains the correctly attributed published result, with 468 h preserved as an unresolved official-source-data label—not a corrected lifetime, and not proof of a unique threshold algorithm.
The 2023 preprint's TSF emitting-layer ratio written as “53:27:20:1 wt%” sums to 101; the final main text explicitly gives 55:30:15 wt% for TADF-only emitting layers, but the published text examined does not sufficiently specify a normalized final TSF recipe to validate the old preprint notation. Accordingly, we do not invent a corrected TSF weight fraction or import the preprint ratio as a definitive published device parameter [1, p. 520; 4, device section].
The paper reports 32 devices fabricated in parallel for EQE reproducibility, supported by SI EQE histograms [1, p. 522; 2, Figs. S12–S13]. This sample count must not be presented as 32 independent lifetime measurements or used to derive LT80 uncertainty. The final Methods and the available published records do not provide a lifetime-pixel replicate distribution or full LT80 fitting algorithm. A 2023 preprint description of constant-current-density aging should not be promoted to a final-version method statement without further verification. Consequently the fold changes are ratios of reported representative device lifetimes, not statistical confidence intervals.
7. The next experiment should resolve the mechanism rather than merely exceed a benchmark
Several focused tests would make the isotope argument more predictive.
Position-selective deuteration. Map C–D incorporation at specific sites in 5CzBN and 5tCzBN, particularly aromatic versus tert-butyl positions. Compare material purity and film morphology for isotope-matched samples, rather than treating bulk D% as a complete chemical descriptor.
Direct post-aging chemical analysis. Quantify degradation products in fresh and electrically stressed devices by appropriately controlled mass spectrometry, chromatographic extraction and spectroscopy. Compare whether H and D analogues produce the same species at different rates or fundamentally different breakdown pathways. Optical photo-aging and ZPE changes alone do not prove the locus of bond cleavage.
Lifetime statistics and stress equivalence. Measure multiple independently fabricated pixels at both matched starting luminance and matched current density, with defined encapsulation, ambient, drive mode and full stack. Publish raw luminance–time series, replicate variation and the precise LT80 extraction algorithm, so the 398/468 h reporting conflict can be reproduced and resolved.
Full sensitization kinetics. In matched TADF-only and TSF films with controlled donor/acceptor loadings, quantify emission quenching, time-resolved donor and acceptor populations, absolute PLQY, orientation and triplet-related pathways. This would distinguish improved Förster transfer from altered charge recombination or optical outcoupling in the corresponding OLED stacks.
A broad molecular generalization set. Repeat site-selective H/D experiments across multiple donor/acceptor scaffolds and host mixtures, ideally with computational modes tied to independently observed degradation chemistry. Two isotopologue families are an informative proof of concept, not a universal screening law.
Conclusion
The published 2024 main article and SI substantiate higher PLQY and reduced model-estimated singlet nonradiative rates in the two studied H/D TADF families, together with improved EQE and reported LT80 in paired TADF and TSF devices. In those same films, neither k_r nor k_RISC rises universally [2, Table S2]; this provides an important counterweight to single-rate explanations. TSF lifetime ratios of approximately 3.16 and 2.43 follow from within-scaffold pairing, not from an invalid comparison between TSF-A and TSF-B as though they were isotopologues of one another.
The study nevertheless does not uniquely identify the electrically activated bond-breaking pathway or establish how much of the LT80 improvement is due to direct chemical isotope effects rather than altered exciton populations, charge stress, morphology or photon extraction. For TSF-B, report EQEmax 33.1%, EQE at 1,000 cd m⁻² 29.0%, CIE y = 0.20 and LT80 1,365 h at initial 1,000 cd m⁻² as separate facts. The source-data conflicts on TSF-A lifetime (398 vs 468 h), TSF-A EQE at 1,000 cd m⁻² (24.1 vs 24.3%) and TSF-B EL FWHM (20 vs 19 nm) remain open pending author clarification.
Editorial synthesis: Isotope substitution is a particularly promising controlled perturbation for studying the interaction of vibronic relaxation, energy transfer and OLED degradation. Turning it into a transferable molecular design rule requires site-resolved H/D chemistry, matched stress, quantitative sensitization kinetics and direct chemical failure analysis—not just a record EQE–lifetime pair.
Sources and editorial disclosure
[1] Published 2024 version of record (FULL TEXT VERIFIED). Huang, T., Wang, Q., Zhang, H., Zhang, Y., Zhan, G., Zhang, D. and Duan, L., “Enhancing the efficiency and stability of blue thermally activated delayed fluorescence emitters by perdeuteration,” Nature Photonics 18, 516–523 (2024), DOI https://doi.org/10.1038/s41566-024-01379-1. User-supplied published PDF: `s41566-024-01379-1(1).pdf`, 9 PDF pages including Methods. SHA-256: `0AE7D1BBCE0D769496CDAE691929973738E942E0E20BB80373FDF8876BD0D97B`.
[2] Official published Supplementary Information. `41566_2024_1379_MOESM1_ESM.pdf`, 26 PDF pages, Supplementary Notes, 30 Supplementary Figures and 4 Supplementary Tables. SHA-256: `358586D2FD7C31A4FF3035E147A2B715A6F90D17B1F2E5F2DB7091F26751FD74`.
[3] Official published Figure Source Data, as inventoried in the user-supplied v0.2 source-reconciliation record. Publisher file `41566_2024_1379_MOESM2_ESM.zip` contains four source-data Excel workbooks. The workbook itself was not included in the current review ZIP, and the Figure4.xlsx summary discrepancy is retained as source-ledger evidence, not independently recalculated in this revision. The supplied record lists SHA-256 A5A48BA7FA597209D77F747C59903B16ECD5F18657A870CEC2C9F4F2850986B3.
[4] Version-bound historical preprint, NOT the 2024 article. Huang et al., “Boosting the Efficiency and Stability of Blue TADF Emitters by Perdeuteration,” Research Square v1 (22 September 2023), DOI https://doi.org/10.21203/rs.3.rs-3354760/v1. Cited only when comparing changed wording/data or describing a method not independently confirmed in the version of record.
Editorial and rights notice. This is an independent OLED Nexus critical commentary on Huang et al. [1]. The numerical tables are selected, attributed comparisons; Figures 1–2 are original educational graphics made from the cited observations and simple ratios, not copies of original publisher figures. No new experimental data, new degradation analysis, independent kinetics fitting, or independent lifetime-replicate statistics are claimed. Source claims are differentiated by direct measurement, fitted model, inferred mechanism and publisher-source discrepancy. Expert-revised v0.3 scientific content approved by the scientific owner on 29 October 2026 and expressly authorized for website publication; actual website acceptance, GitHub merge and deployment must be verified separately.